Accessibility practices and tools: Tables
Make data tables accessible and structured.
Tables can be helpful for presenting data, but they must be formatted properly so that screen reader software can interpret them. Avoid using tables for layout or decorative formatting—they can confuse assistive technologies and create barriers for users.
Why it matters
- Screen readers navigate tables by reading the relationship between cells and their headers.
- Poorly formatted tables are often read aloud by a screen reader as a flat list of content, making them confusing or unusable.
- Proper table structure improves clarity and usability for all students—not just those using assistive technologies.
What to do
DO use tables only for presenting data.
EXAMPLE:
| Substance | Density |
|---|---|
| Oil | 0.8 g/mL |
| Water | 1.0 g/mL |
| Plastic | 0.9 g/mL |
| Rock | 4.2 g/mL |
| Aluminium | 2.3 g/mL |
AVOID using tables for layout.
EXAMPLE:
 |
Dr Smith Lecturer Faculty of Arts and Education |
Make sure every data table has:
- A clear, descriptive title above the table (not inside it)
- Column or row headers that define the data
- Properly identified header cells using built-in styles or tagging
- Avoid empty rows, merged cells, or complex nested tables
Getting it right
In Canvas
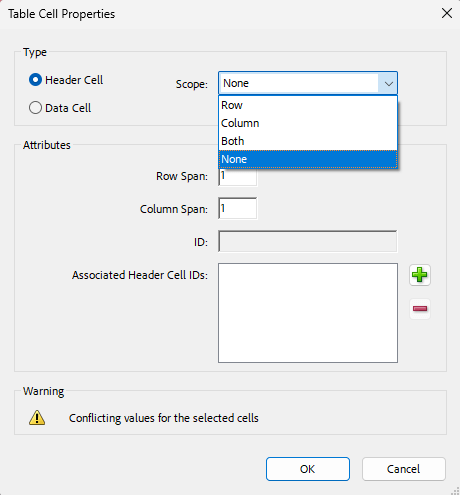
Highlight the cells in the table which contain headers. Then look for the Table icon in the Rich Content Editor’s toolbar (you may need to expand the toolbar via the three dots). Mouse over Cell and click Cell properties.
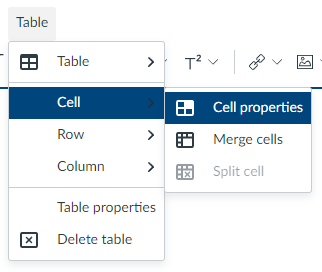
Under Cell type, select Header cell then continue to set the scope of the headers or click Save.

Setting the scope of table headers helps screen readers determine the direction of the table. The scope is set in Cell properties.
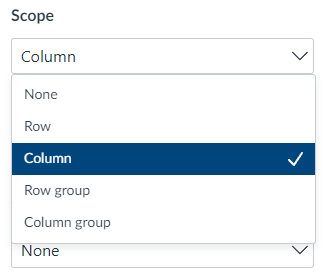
The options include:
Row – for header cells spanning the row.
Column – for header cells spanning the column.
Row group – for header cells spanning multiple rows.
Column group – for header cells spanning multiple columns.

Where possible, avoid creating complex tables that use row groups and column groups. Instead, consider splitting a complex table into two or more smaller tables.
In UDOIT Advantage
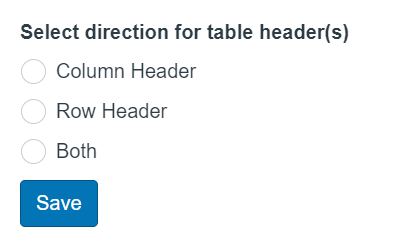
If UDOIT reports, “No table headers found“, click the ‘Review’ button for more information. Select the header option (column header, row header or both) for your table and click ‘Save’.
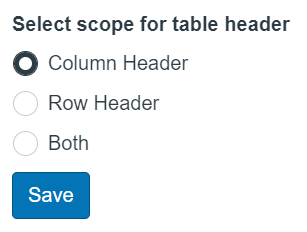
If UDOIT reports, “No row or column scope declarations found in table headers“, click the ‘Review’ button for more information. Select the option that defines the scope for your table headers and click ‘Save’.
If UDOIT reports, ““Pre” elements should not be used for tabular data“, it means there are <pre> elements within the HTML. These preserve the layout and spacing (including tabs), which allows for ‘content that looks like a table’. However, screen readers and browsers perceive this as text rather than structured data. This issue cannot be resolved in the UDOIT tool. Edit the Canvas page, create a new table and copy the data in to the table.
If UDOIT reports, “Table without content detected“, the UDOIT tool has found an empty table. This problem cannot be resolved in UDOIT. Edit the page in Canvas and populate the table with data or delete the table.
In Microsoft Word or PowerPoint
- Use the “Design” tab to set the top row as a header.
- Ensure header rows repeat on each page if the table spans multiple pages (Word).
- Use the Accessibility Checker to scan for missing headers or structural problems.
View details about creating accessible tables in Word.
In Adobe Acrobat Pro (PDFs)
- Use the “Reading Order” tool to tag the table.
- Ensure headers are identified and that scope is set (row or column).
- Run the full accessibility check to confirm logical reading order.
Related Canvas Baseline Practices and Universal Design for Learning
- Canvas Baseline Practices recommend using well-structured content with clear formatting and accessible layout.
- Universal Design for Learning supports presenting information in ways that allow all learners—including screen reader users—to understand the structure and relationships between data.
Tools and checks
- UDOIT (Canvas) – identifies tables missing headers or used improperly.
- Canvas Accessibility Checker – flags structural table issues.
- Microsoft Accessibility Checker – prompts you to define header rows and scopes.
- Design Blocks for Canvas – enables accessible alternatives to using tables for page layout (see Grids).
Page updated 27/11/2025 (minor edit)