Course Analytics
Analytics displays current class performance and engagement. Learn how to view analytics data in Canvas.
On this page
- Access Course Analytics
- Key areas within the new Canvas Analytics
- Message students who …
- Support
- See also
Access Course Analytics
Access Course Analytics from the Canvas course menu. The Analytics data is refreshed every 24 hours so it will not show the latest data.
If the item is not visible in the course menu, go to Settings > Navigation and move Course Analytics to ‘above the line’. See: Instructor guide: How to I manage Course Navigation links?
Read more about:
- Canvas basics guide: What is Course Analytics?
- Instructor guide: Course Analytics
- Student Access report in UoA Toolbox. It generates an up to the minute report on student access in a .csv file.
Key areas within the new Canvas Analytics
Course grade average
You can compare the course average with an individual assignment, course section, or student filter using the chart graph comparison or data table comparison.
- Click the Assignment ‘dot’ or Quiz ‘dot’ to view the grades distribution and number of missing/late submissions.
- From the Average Course Grade, teachers can quickly message students who were missing/late or achieved specific criteria (e.g., 0% to 50%).
- You can filter students by adding ‘sections’ (e.g., L01, B02, T03 etc.). See Sections and Groups in Canvas.
- Teachers in the course can message students based on criteria within the section.
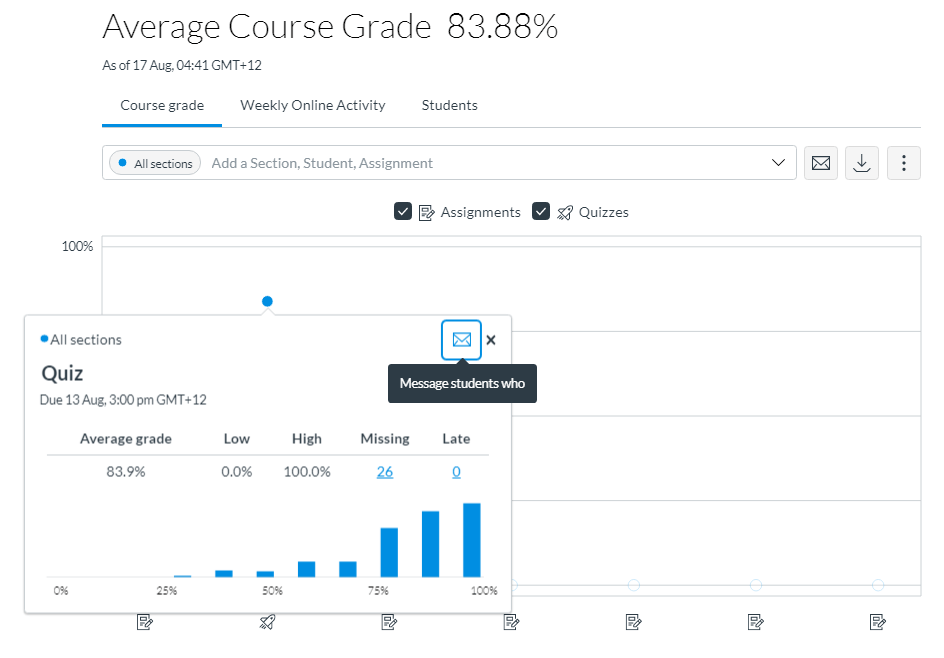
Figure 1: Clicking the Quiz dot opens a popup with a message students button.
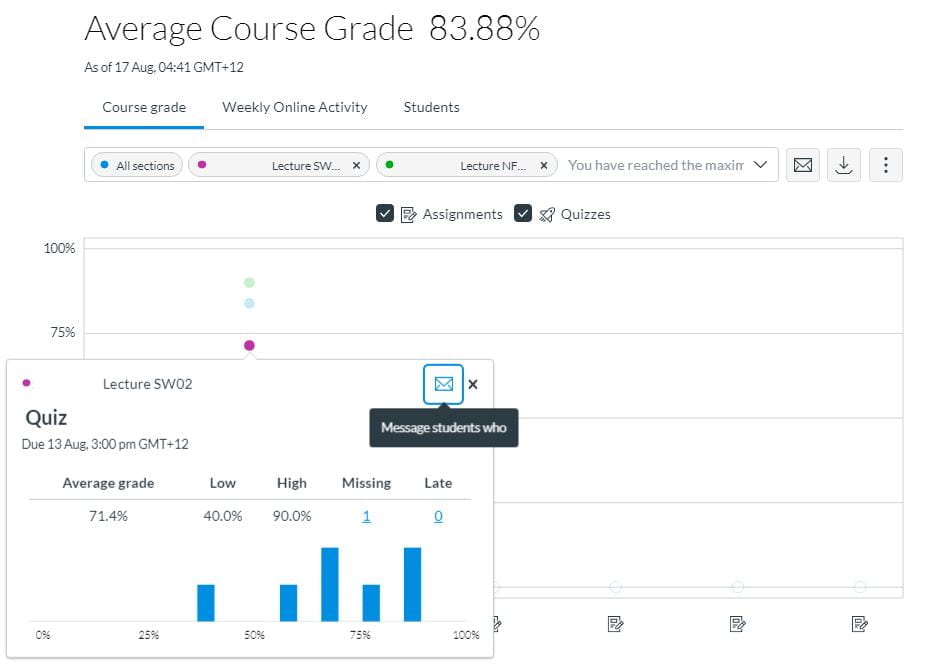
Figure 2: Adding sections to the analytics display filters students by section.
Weekly online activity
You can view average weekly online participation analytics as an interactive chart graph or a data table.
Compare the course average weekly online participation analytics with an individual student or section using the chart graph comparison or data table comparison.
- Use the filter by adding ‘sections’ (e.g., L01, B02, T03 etc.).
- Click the coloured dots to view engagement activity by section.
- Participations includes submitted quiz, added to a discussion etc.
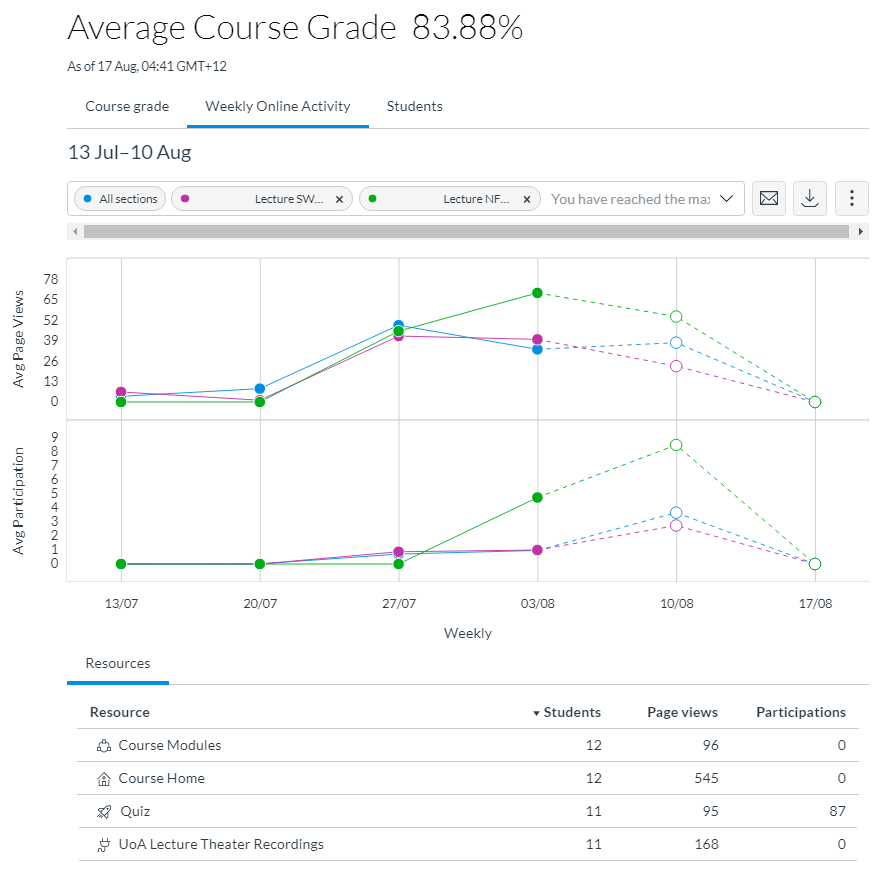
Figure 3: Weekly online activity graph can also be filtered by student sections.
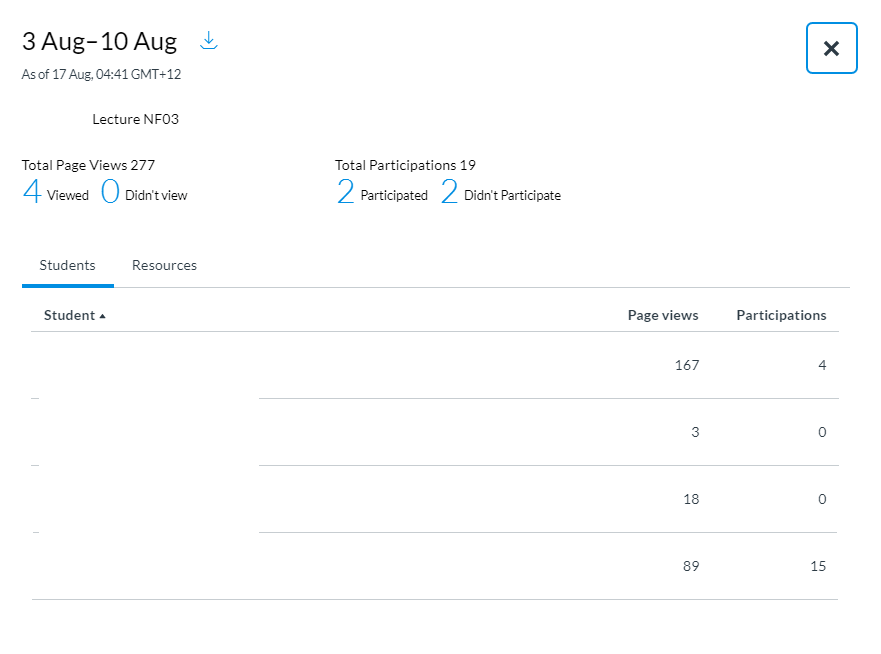
Figure 4: A view of page views and participation for each student. Names have been redacted.
Grade and participation
- View course grade and participation analytics for an individual student.
- View the student overall participation by sections.
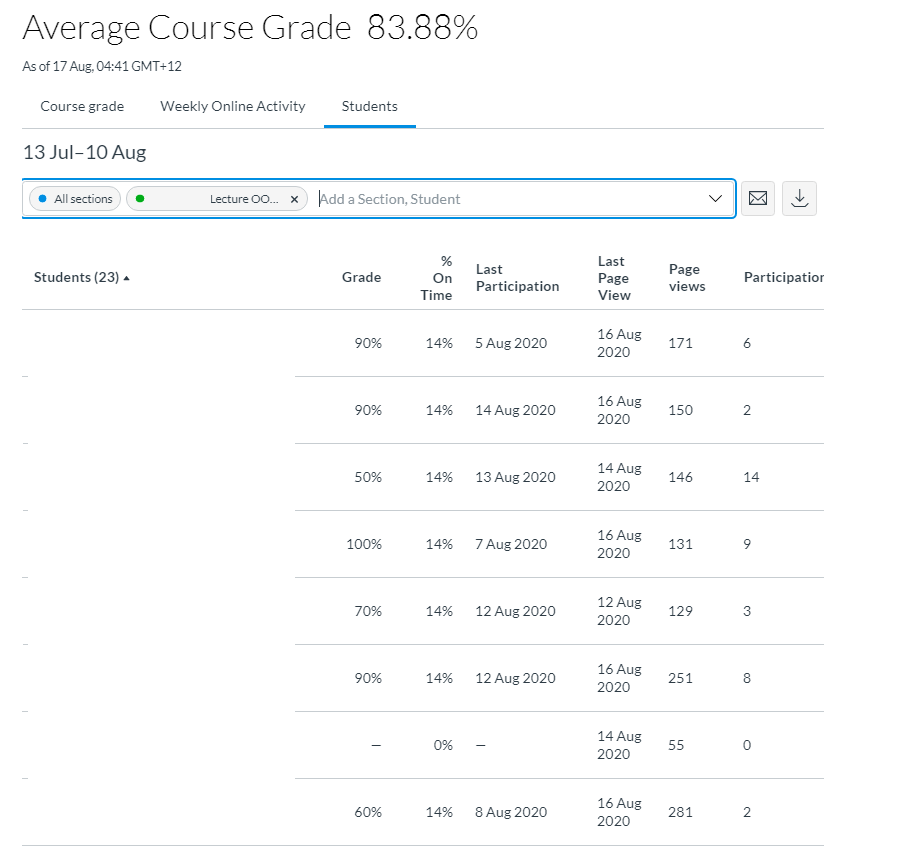
Figure 5: View stats for each students from the students tab (can be filtered by sections). Names have been redacted.
Message students who …
Visit the Canvas Instructor guides to learn how to:
- Message all students based on their participation.
- Message an individual student based on their participation.
- Message students from the Gradebook, e.g., who have not submitted an assignment or have scored a certain point value.
Support
Check out our learning technology support page to find out what options are available for Canvas.
On this page
- Access Course Analytics
- Key areas within the new Canvas Analytics
- Message students who …
- Support
See also…
Page updated 17/12/2025 (minor edit)